Mathematics is the only exact science. All power under heaven and on earth is given unto the man who masters the simple science of mathematics. Emerson said " God does indeed geometrize." Another wise man said " There is nothing in the universe but mathematical points " Pythagoras, one of the greatest mathematicians that ever lived, after experimenting with numbers and finding the proofs of all natural laws, said " Before God was numbers." He believed that the vibration of numbers created God and the Diety. It has been said, " Figures don't lie. " Men have been convinced that numbers tell the truth and that all problems can be solved by them. The chemist, engineer and astronomer would be lost without the science of mathematics. There are three kinds of angles -- the vertical, the horizontal, and the diagonal, which we use for measuring time and price movements. We use the square of odd and even numbers to get not only the proof of market movements, but the cause.


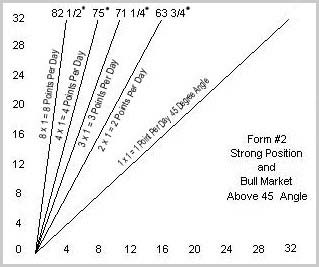
First Important Geometrical Angle : 45° or 1 x 1

The first and always most important angle to draw is a 45-degree angle or a moving-average that moves up one point per day, one point per week or one point per month. This is a 45° angle because it divides the Space and Time Periods into two equal parts. As long as the market or a stock stays above the 45° angle, it is in a strong position and indicates higher prices.

You can buy every time a stock rests on the 45° angle with a stop loss order one, two or three points under the 45° angle, but remember the rule - never use a stop loss order more than 3 points away, Unless stocks are near the low levels or just starting in a bull market or selling at very low prices, I always use a stop loss order one point under the 45° angle. If this angle is broken by one point, you will usually find that the trend has changed at least temporarily and the stock will go lower.

An easy way to calculate accurately how to put this 45° angle is :

For example : If the time is 28 days, 28 weeks, or28 months from the point where the stock was bottom, then the angle of 45° must be 28 points up from the bottom and would cross at 28. this is one of the easiest angles to put on and one of the simplest to learn.You can beat the market by trading against the 45° angle alone if you stick to the rule -- wait to buy a stock on the 45° angle or wait to sell it against the 45° angle.

Next Important Angle : 2 x 1

The angle of 2 x 1 or the moving-average which moves up at the rate of 2 points per day, week, or month. It divides the space between the 45° angle and the vertical angle into two equal parts and measures 63 ¾°. That is why it is the next strongest and most important angle. As long as a stock holds above this angle, it is in a stronger position than when it is resting on a 45° angle because it is a more accute angle. When a stock breaks under the angle of 2 x 1, or two points for each time period, then it indicates that it will go lower and reach the 45° angle. Remember the rule of all angles : No matter what angle the stock breaks under, it indicates a decline to the next angle below it.

Third Important Angle : 4 x 1

Which is still stronger as long as stock holds above it,is the angle which moves up 4 points per day, week, month. This angle is 4 x 1, or 4 points of space equal one period of time. It measures 75° and divides the space between the angle of 2 x 1 and the 90° angle into two equal parts. Any stock that continues to advance 4 points per day, 4 points per week, or 4 points per month, and remains above this angle is in a very strong position as long as it stays above it, but when it breaks under, it indicates the next angle or next support point according to the position of the stock on Time.

Fourth Important Angle : 8 x 1

Is the angle 8 x 1 or the one that moves up 8 points per day, week, or months. This angle measures 80 ½°. As long as a stock can hold above this angle on a daily, weekly, or monthly chart, it is in a strongest possible position, but when it reverses trend and declines below this angle, then it indicates a decline to the next angle.

Next Angle : 16 x 1

It is possible to use an angle or 16 x 1, or 16 points of Price to one period of Time, which measures 86 ¼°, but this angle is only used in fast, advancing markets, like 1929, when stocks are moving up or down 16 points or more per week or per month. There are very stocks that will move up 16 points per day, week, or month, and very seldom.

You will note that with these four important angles we show the strong or bullish side of the market. All the time by dividing the Space with angles we are getting the half - way point or the gravity center of Time and Price.

3 x 1 Angle :

Note the angle drawn in Green, marked " 3 x 1 ", which moves up at the rate of 3 points per day, week, or month, measuring 71 ¼°. This angle is important at times after markets have had a prolonged advance and are a long distance up from the bottom. It is an important angle to use on Monthly and Weekly charts.

These are all the angles you need as long as a stock continues to advance and work up and stays above the angle of 45° or the moving average of one point per day, week, or month.

While there are 360 degrees in a circle and angles can form at any of these degrees, all of the important angles form between ' 0 ' and ' 90 ' because 90 is straight up and down and the most acute angle on which a stock can rise. For example: The 45° angle divides the space from ' 0 ' to ' 90 ' in half. The angle of 135° is simply another angle of 45° because it is one-half of the next quadrant between 90 and 180. 225 and 315 in a circle are also 45° angles. Therefore all of the angles valuable in determining the trend of a stock are found between ' 0 ' and ' 90 ' degrees. When we divide 90° by 8 we get the most important angles to use -- then divide it by 3 we get 30 and 60° angles, which are important to use for Time and Resistance Points.


U.S. Government Required Disclaimer - Commodity Futures Trading Commission.

Forex, futures and options trading has large potential rewards, but also large potential risk. You must be aware of the risks and be willing to accept them in order to invest in the Forex, futures and options markets. Don't trade with money you can't afford to lose. This website is neither a solicitation nor an offer to Buy/Sell Forex futures or options. No representation is being made that any account will or is likely to achieve profits or losses similar to those discussed on this website. The past performance of any trading system or methodology is not necessarily indicative of future results.

Trading in the Foreign Exchange market is a challenging opportunity where above average returns are available for educated and experienced investors who are willing to take above average risk. However, before deciding to participate in Foreign Exchange (FX) trading, you should carefully consider your investment objectives, level of experience and risk appetite. Do not invest money you cannot afford to lose.

CFTC RULE 4.41 - HYPOTHETICAL OR SIMULATED PERFORMANCE RESULTS HAVE CERTAIN LIMITATIONS. UNLIKE AN ACTUAL PERFORMANCE RECORD, SIMULATED RESULTS DO NOT REPRESENT ACTUAL TRADING. ALSO, SINCE THE TRADES HAVE NOT BEEN EXECUTED, THE RESULTS MAY HAVE UNDER-OR-OVER COMPENSATED FOR THE IMPACT, IF ANY, OF CERTAIN MARKET FACTORS, SUCH AS LACK OF LIQUIDITY. SIMULATED TRADING PROGRAMS IN GENERAL ARE ALSO SUBJECT TO THE FACT THAT THEY ARE DESIGNED WITH THE BENEFIT OF HINDSIGHT. NO REPRESENTATION IS BEING MADE THAT ANY ACCOUNT WILL OR IS LIKELY TO ACHIEVE PROFIT OR LOSSES SIMILAR TO THOSE SHOWN.

DISCLAIMER: The information on this site is for educational purposes only. Our website is not qualified or licensed to provide financial advice. You must seek guidance from your personal advisors before acting on this information. Trading can result in losses. We will accept no responsibility for any losses you may incur. Do not invest more than you can afford to lose. Please see other Disclaimers and Warnings elsewhere on this site.

By entering our website and/or purchasing our systems/tools/analysis, you agree to hold harmless the owners, principles, managers and all affiliates and associates of this website, for any and all losses you may incur by purchasing and using any of the Trading Systems.